Google Analytics in web AR: GA4
The online code editor allows the developer to connect the AR experience built in Studio with their Google Analytics account like with any other webpage.
To properly set up your project you can follow these steps.
Step 0: Create a new Analytics property
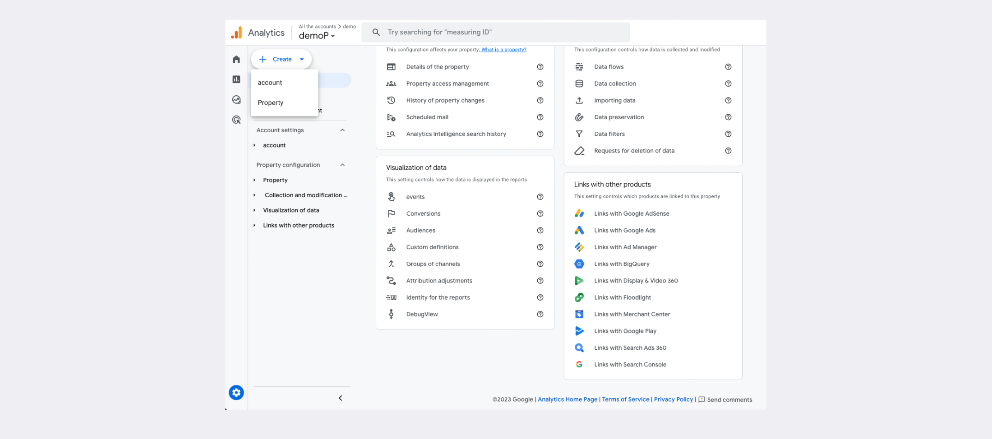
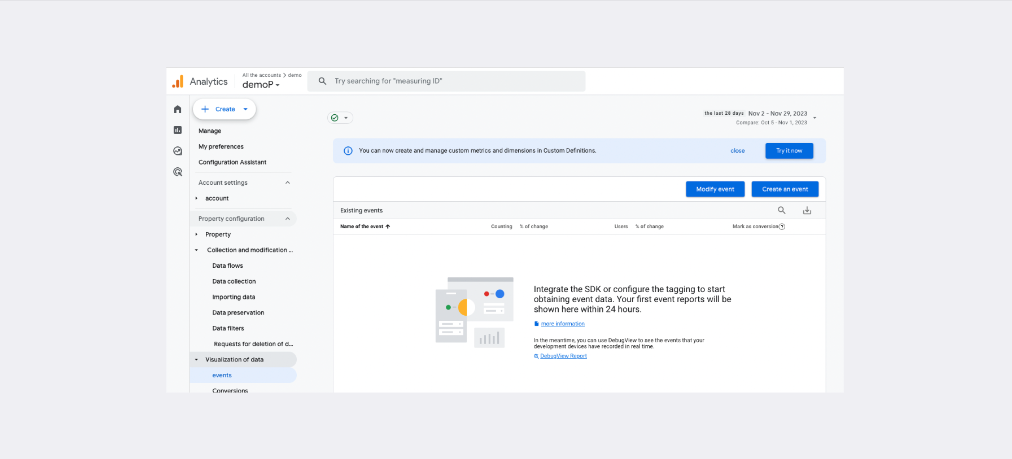
On the Google Analytics dashboard navigate to Manage in the bottom left corner. At this moment you have two options, the first is to create a new account that includes the entire process to create a new property and the second is, having already had an account, to create only the property.
In both cases, you need to go to the top left corner and select Create account or Create property. Regardless of what you choose, you must fill out the fields following Google's instructions.
Step 1: Set up a data stream
Once the new property has been created, you need to create a new data stream to obtain the tagging information for your project. To do this, you must go to the Manage > Collection and modification of data > Data flows.
In this case, as you are creating a Web AR project, you need to select Web as the platform for the new stream. After clicking, a new form will appear asking for your website's URL and the name for this new stream.
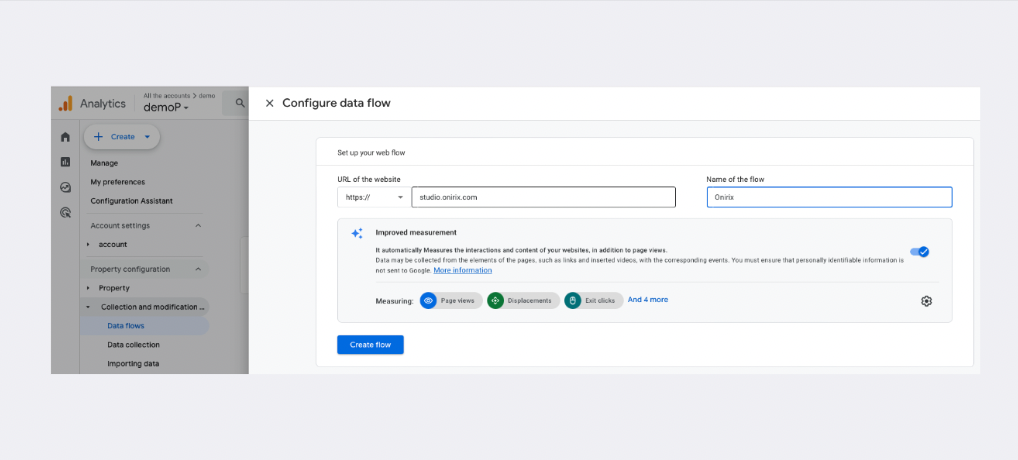
It's important to note that, although the AR experience is hosted on an Onirix domain, the URL of the data stream doesn't need to match it in order to collect the data. For example, you can use the URL of your company's webpage or the domain where you are going to embed the AR experience. The only constraint is that the URL is a valid one.
Step 2: Embed the script in the code editor
After the web stream is created, Google will generate a Measurement ID that identifies the stream and enables you to connect the project to Google Analytics. This data is found in the information about the new data flow created. If you select the new flow in the flow table you will be able to see this value in the upper right corner.
Firstly, you need to set the project as public and open the code editor. To achieve this:
- Open Onirix Studio.
- Select the project that you want to collect data from.
- Click Share in the top bar and make sure the project is set to Public.
- On the Embed, tab click Open code editor.
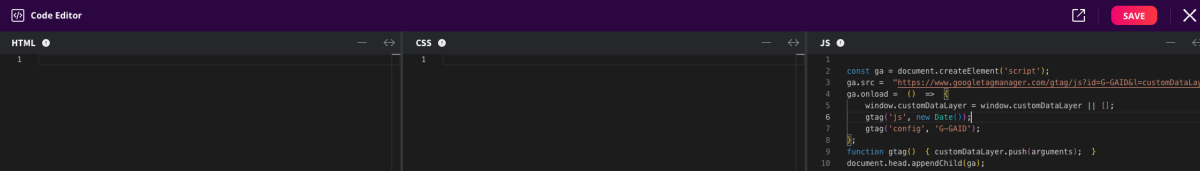
Now, on the JS section, you need to create a new script element with the link to Google Analytics JavaScript file provided under See labels instructions > Install manually. As in the case of Measurement ID, this script is found within the new flow information.
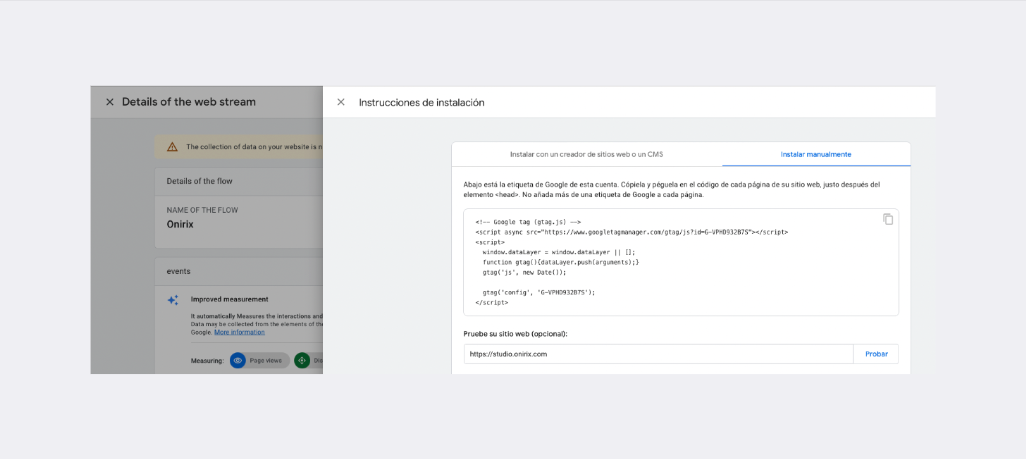
DataLayer is the name used by default in Google Analytics, but it is recommended to use your own name to avoid collisions with other projects or when the experience is embedded in another website because they can use Google Analytics and record unnecessary events. In this case we use a custom data layer that is defined as a new parameter of the script URL as &l=customDataLayer and is used in the window data layer definition and in the gtag function.
The resulting code will look something like this:
    const ga = document.createElement('script');
    ga.src =  "https://www.googletagmanager.com/gtag/js?id=G-GAID&l=customDataLayer";
    ga.onload =  ()  =>  {
        window.customDataLayer = window.customDataLayer || [];
        gtag('js', new Date());
        gtag('config', 'G-GAID');
    };
    function gtag()  { customDataLayer.push(arguments);  }
    document.head.appendChild(ga);
Remember to change G-GAID to the Measurement ID of your data stream.
Step 3: Add custom events
Google Analytics already provides some useful events like visit, scroll, click, etc. However, this is usually not enough and more personalized events are needed. For this example two events will be created: one when a scene is loaded and one when an AR element is clicked.
To achieve this, inside the Analytics dashboard, navigate to Manage > Visualization of data > Events.
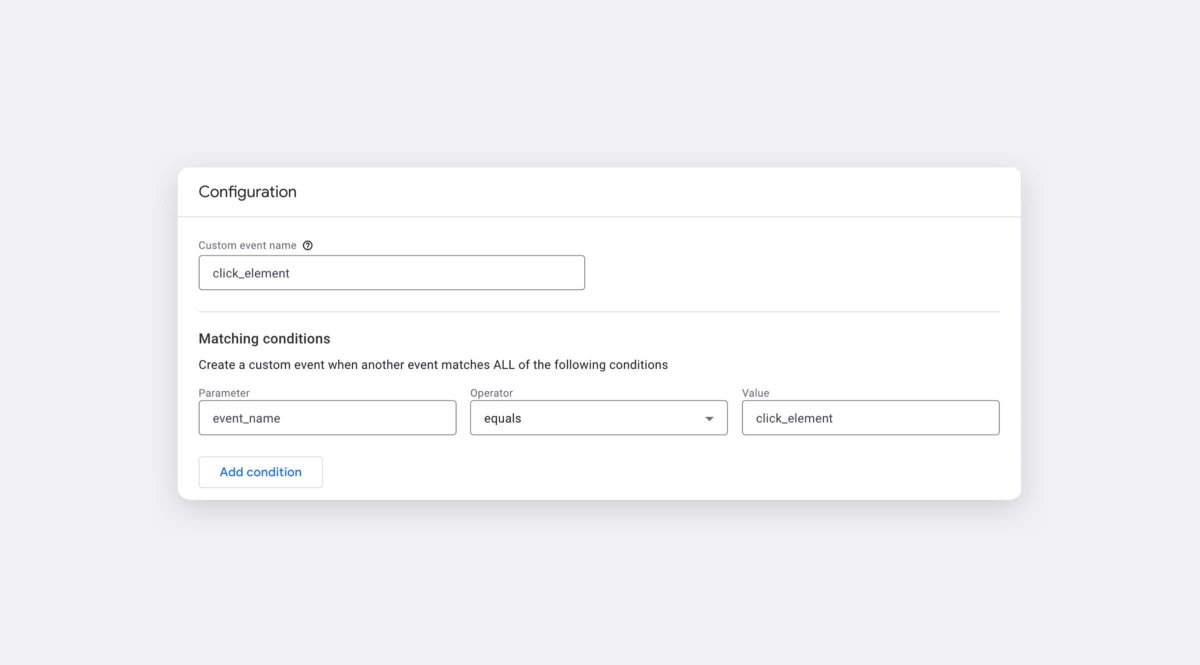
Once you are there, click Create event, choose the desired data stream and click Create. Google will open a form to define the new event, input the name of the new event and set the condition that the event must meet in order to be registered and classified correctly by Google Analytics. For this event: event_name will be defined as scene_load.
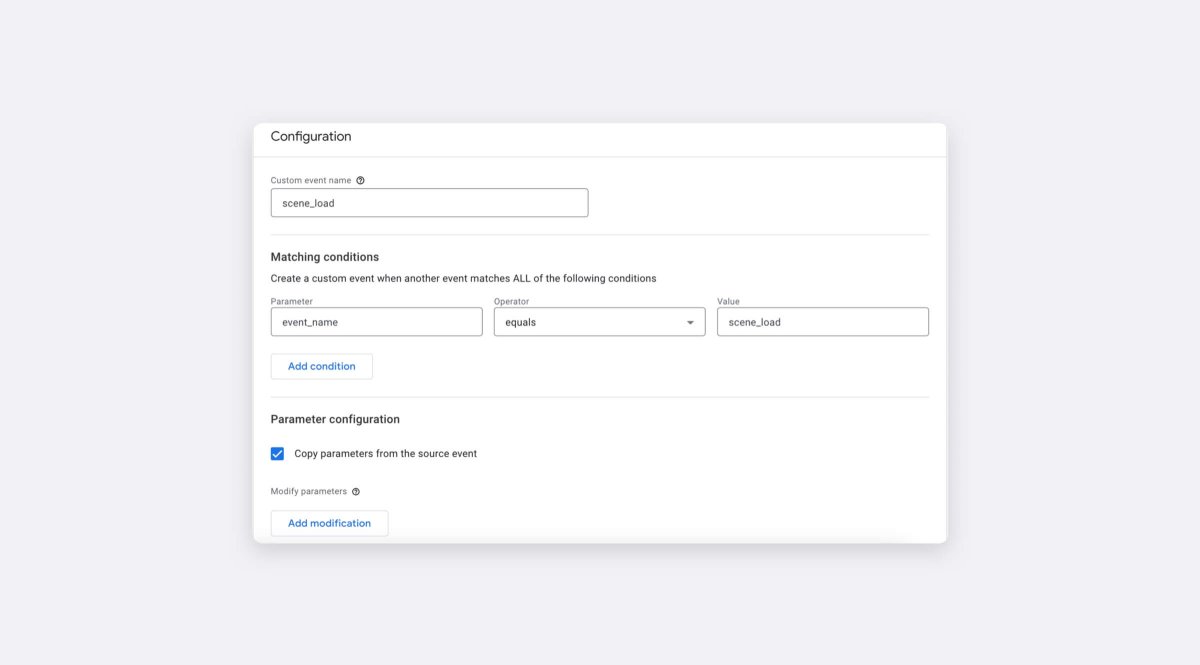
Once you have filled the form, save it and you will see it added to the custom events table.
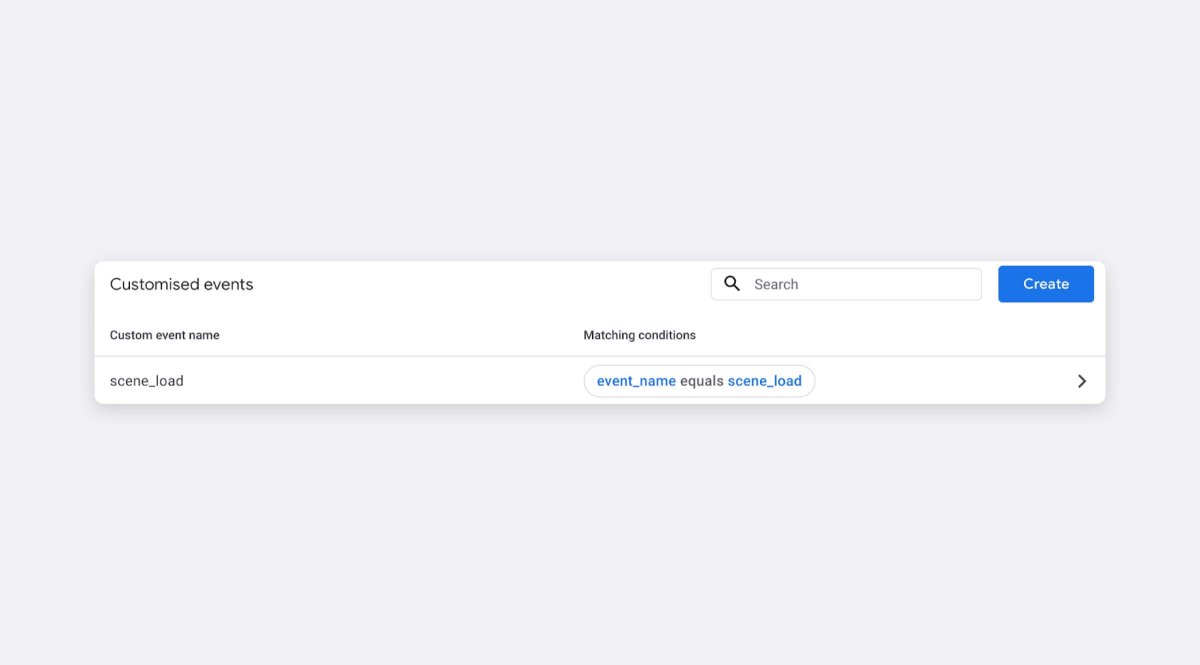
Before going back to the code editor, click Create again and define the new event for clicking elements inside the AR experience. It should look like this:
Next, open the Studio code editor. Here, in the JavaScript section after the Google Analytics initialization, you have to do three different things:
- Import the Onirix SDK and connect to it.
- Subscribe to the scene load ended event and launch GA event.
- Subscribe to the element clicked event and launch the GA event.
To achieve this, you must create a script element with the link to the Onirix SDK as src and, in its onload, connect to the SDK, subscribe to the events and, through the gtag method, register the new custom events you just defined in Analytics. The resulting code will be similar to this:
const script = document.createElement('script');
script.src = "https://sdk.onirix.com/embed/ox-embed-sdk.umd.js";
script.onload = async () => {
   const embedSDK = new OnirixEmbedSDK();
   await embedSDK.connect();

   embedSDK.subscribe(OnirixEmbedSDK.Events.SCENE_LOAD_END, (params) => {
       console.log("Scene with oid: " + params.oid + " was loaded!");
       gtag('event', 'scene_load', {'value': params.oid, 'item_name': params.name });
   });

   embedSDK.subscribe(OnirixEmbedSDK.Events.ELEMENT_CLICK, (params) => {
       console.log("Element with oid: " + params.oid + " was clicked!");
       gtag('event', 'click_element', {'value': params.oid, 'item_name': params.name });
   });

};

document.head.appendChild(script);
Step 4: Checking that it works
After saving the contents of the code editor, you should check if the project is correctly communicating with Google Analytics and that the data is being shown correctly on the dashboard.
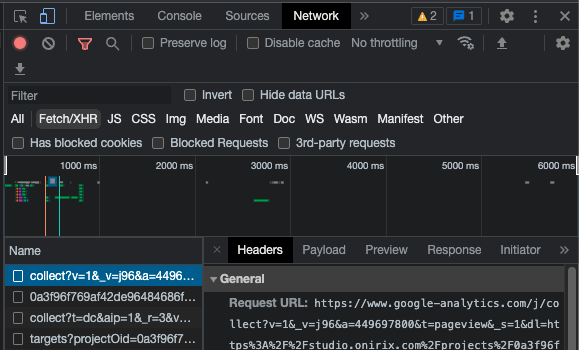
In order to test it, go back to the project on Studio, click Share, copy the URL on Onirix Link and open it in a new tab. Then, inspect the page with browser’s tools and search for a /collect request to google-analytics. If the requests do not appear, check that ad-blocking extensions like uBlock Origin are disabled, as they can interfere with Google Analytics.
If the call was correctly made, you will see the statistics update on Google Analytics if you navigate to Reports > Real-time.
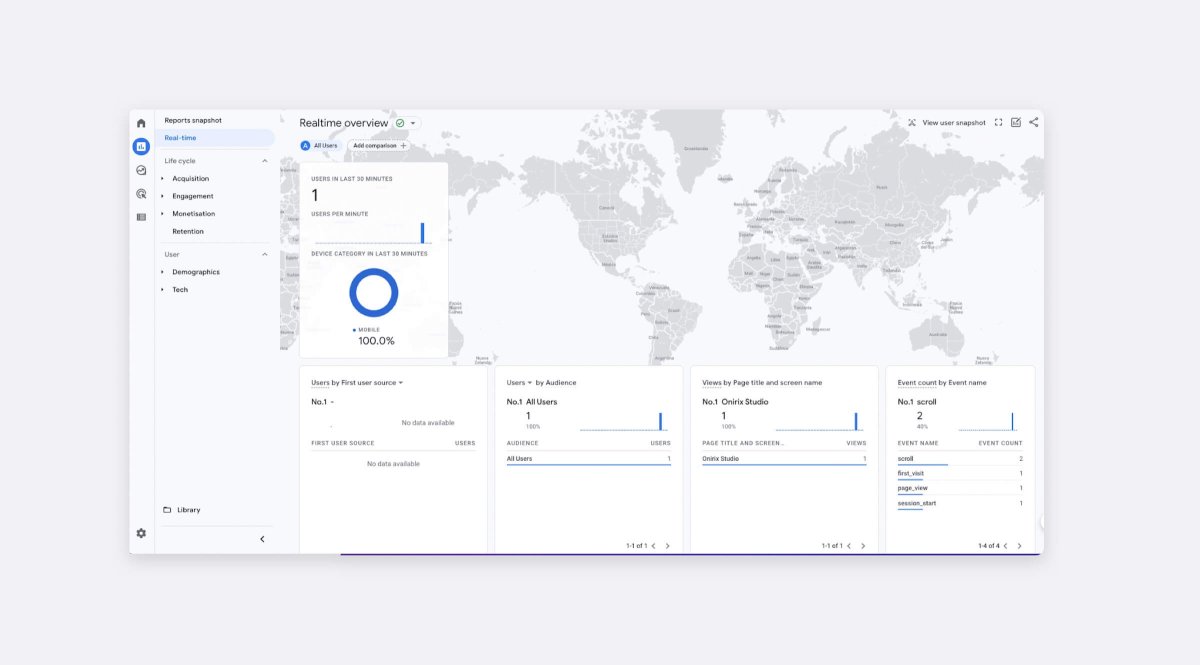
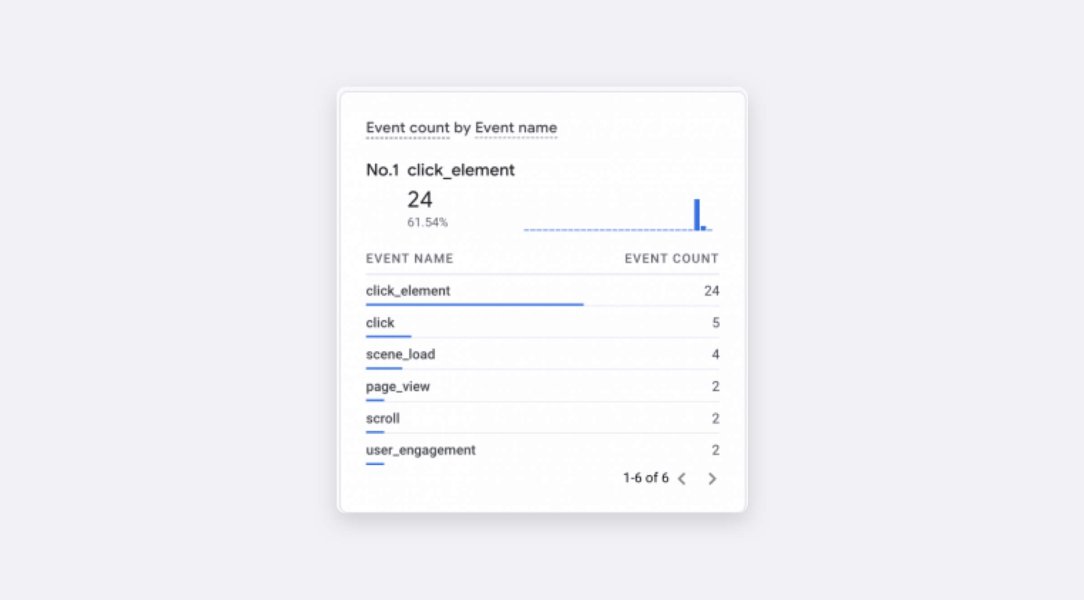
Finally, click the elements you have placed inside the AR scene and look for the scene_load and click_element events on the Event count graph. You can click on it to see the values and names that have been sent in the events.